We are proud to announce the release of the Vendia MCP Gateway Insights Dashboard, giving teams a centralized view of tool health, usage patterns, latency trends, and connected data sources — all in one place.
This release introduces real-time observability for every tool call made through the Vendia MCP Gateway. Slice charts and understand KPIs by time window. Zoom in to debug a spike or pull back to track trends over weeks.
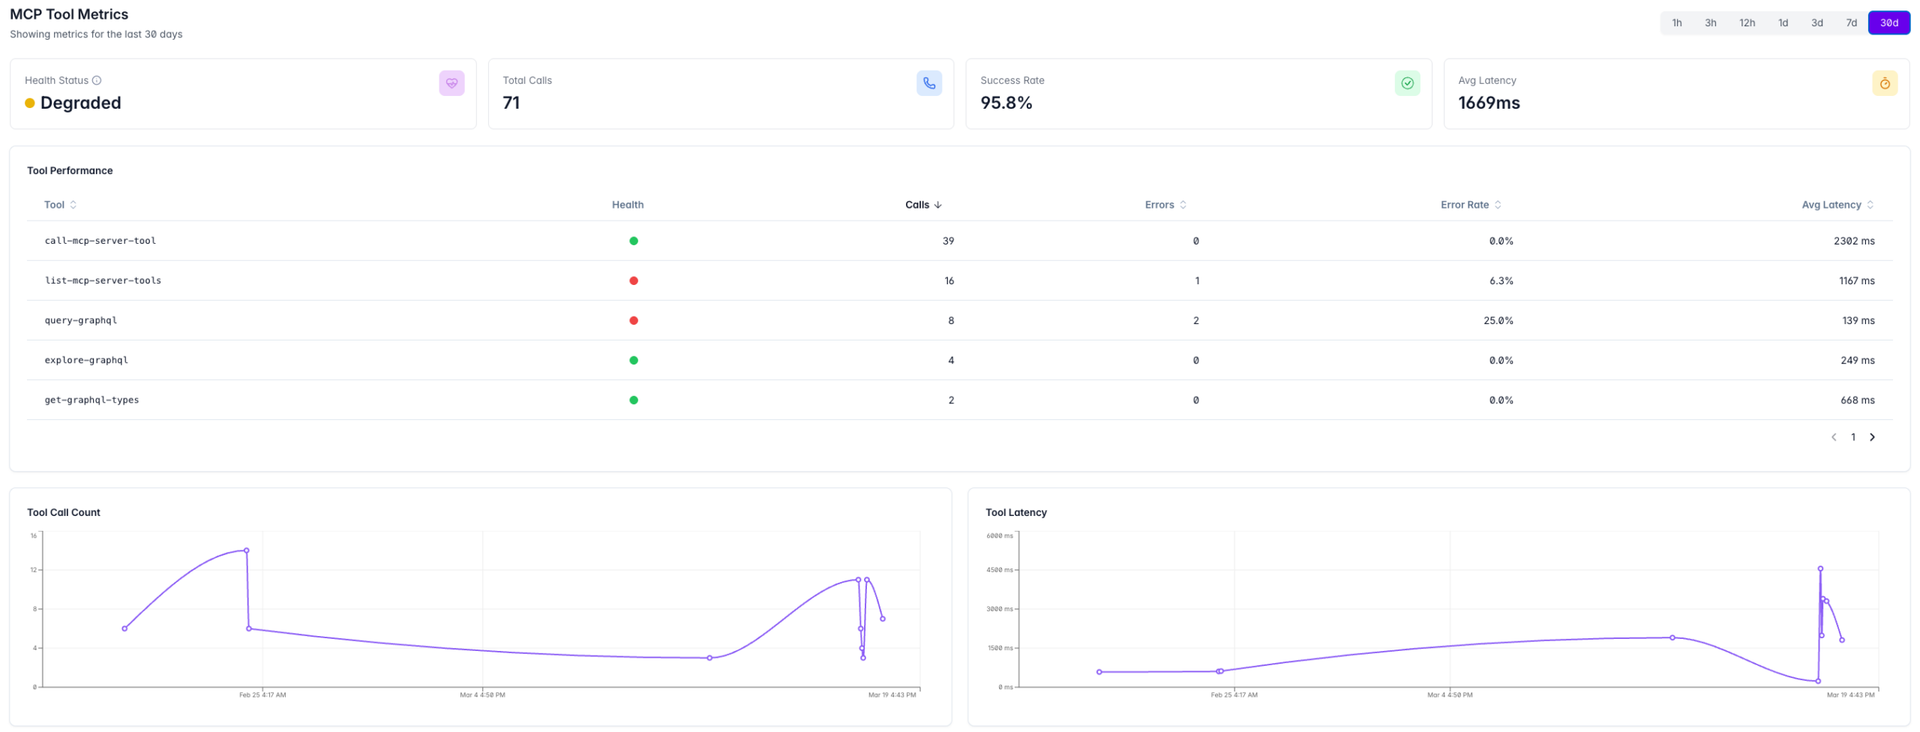
Health KPIs
Understand tool health and performance. Three top-level indicators — Total Tool Calls Tracked, Tool Success Rate, and Average Tool Latency — give you an instant read on gateway health before anyone files a bug report.
Per-Tool Health Indicatorss
When something breaks, you need to know where. Drill down into individual tool performance with dedicated visibility into call volume, error rates, and latency per tool.
Time-Series Charts
Spot patterns and trends that point-in-time metrics miss. Three dedicated chart views — Tool Call Count, Tool Latency, and Tool Errors — show how your gateway behaves over time.
Top User Activity
Plan capacity, understand adoption, and identify power users. User-level call attribution surfaces which users are driving the most activity across the gateway.
Connected Data Sources
Know when a connection drops before your users do. See which remote data sources are connected to the gateway and monitor their connection status in real time.
The Vendia MCP Gateway Dashboard is available in the Free, Pro and Enterprise tiers. For more information visit docs.vendia.com
This release introduces real-time observability for every tool call made through the Vendia MCP Gateway. Slice charts and understand KPIs by time window. Zoom in to debug a spike or pull back to track trends over weeks.
Health KPIs
Understand tool health and performance. Three top-level indicators — Total Tool Calls Tracked, Tool Success Rate, and Average Tool Latency — give you an instant read on gateway health before anyone files a bug report.
Per-Tool Health Indicatorss
When something breaks, you need to know where. Drill down into individual tool performance with dedicated visibility into call volume, error rates, and latency per tool.
Time-Series Charts
Spot patterns and trends that point-in-time metrics miss. Three dedicated chart views — Tool Call Count, Tool Latency, and Tool Errors — show how your gateway behaves over time.
Top User Activity
Plan capacity, understand adoption, and identify power users. User-level call attribution surfaces which users are driving the most activity across the gateway.
Connected Data Sources
Know when a connection drops before your users do. See which remote data sources are connected to the gateway and monitor their connection status in real time.
The Vendia MCP Gateway Dashboard is available in the Free, Pro and Enterprise tiers. For more information visit docs.vendia.com