


At Vendia, we listen to the needs of our customers and we try to put ourselves in their shoes. The best way for us to know what it’s like to walk in their shoes is by asking them. Recently, two major themes have emerged:
- Customers want better read and write times.
- While customers had several methods for seeing transactional failures, they still needed the ability to see the operational metrics of the Vendia platform itself.
Today we are happy to announce two new features to Vendia Share addressing both of these asks: Low latency operations through new consistency modes and Uni and Node operational metrics and dashboards.
Low latency reads through new consistency modes
Writing data to Vendia is a multi-step process. Vendia operates as a decentralized database used by multiple participants. Each participant gets a copy of the data, and Vendia manages the challenge of keeping that data consistent across all the parties as changes are made. Writing data into Vendia is a multipart process:
- Incoming data must pass integrity checks, such as ensuring a value is greater than 0 or that a string contains a certain value.
- Data must go through consensus, which involves all the participating nodes agreeing the transaction is valid and can be written to the database.
- Once consensus has approved the transaction, the data must be written to all the Node’s world state and into the ledger, which means replicating the data across parties and potentially across cloud providers.
All of these steps take time to complete. Until today, before you could query the data, the transaction would need to be written to the world state on that node and the ledger. We chose this design to prevent potential dirty reads.
But, there may be cases where you prefer response speed over data completeness (i.e., potentially a dirty read). For example, an application that shows the approximate availability of inventory might prefer to show inventory data quickly—even if that data is from a few minutes ago, rather than waiting for the most up to date inventory count. Likewise, there may be use cases where you prefer data completeness over response speed (i.e., there can be no dirty reads). For example, you may have the need to only return data when all participants have accepted and written the transaction into the world state and the ledger.
To address the different needs of customers, we’re introducing different consistency modes for reading (querying or listing), subscribing, or performing synchronous mutations (Table 1). Clients have the option of providing their preferred consistency mode when issuing a query, subscription or a synchronous mutation.
Table 1: Different Consistency Modes
| Type of Consistency | Dirty Reads | Synchronous E2E Response* | Consistency Guarantees |
| CACHED | Very possible | Very fast | Transactions are written to a local cache on a given Node and can be out of date up to cache timeout. |
| NODE_COMMITTED | Possible | Fast | Transactions are written to the world state on a given Node but, perhaps, not yet to the ledger. |
| NODE_LEDGERED | No | Slow | Transactions are written to the world state and ledger on a given Node. |
| UNI_LEDGERED | No | Slowest | Transactions are written to the world state and ledger on all Nodes. |
*The Synchronous E2E Response is the overall latency as compared to the other consistency modes. Our definition of “slowest” simply means this is the slowest end-to-end latency of all four consistency modes.
Prior to this change, NODE_LEDGERED was the default mode for reads and synchronous writes. As part of this change, we have made NODE_COMMITTED as the default mode if you don’t provide a consistency mode as part of a query, subscription or synchronous mutation.
Let’s see how you use the new consistency modes with an example:
Query Example
Let’s assume you prefer maximum speed of response over the data consistency. In this case, you will likely use the CACHED consistency mode. To select the consistency mode, you add the readMode parameter to your query.
query getShapeQuery {
  get_Shape(id: "0180f1d5-7b0c-c03a-dd22-54eb75b807ef", readMode: CACHED) {
	color
	name
	num_sides
}
Synchronous Mutation Example
Let’s assume you need to ensure that the data is written to at least your local Node before a response is returned. In this case you will likely use the NODE_LEDGERED consistency mode. To select the consistency mode, you add the syncMode parameter to your mutation.
mutation addShapeMutation {
  add_Shape(
	input: {color: "blue", name: "hexagon", num_sides: 6}
	syncMode: NODE_LEDGERED
  )
}
Vendia Metrics
Most companies will go through an operational readiness review (ORR) before launching a product or a new feature. ORRs all have the same goal: To help you find blind spots in your operations ahead of launch. One of the main goals of an ORR is to ensure you have the right metrics and alarms to ensure the availability of the product or feature.
Today we are excited to announce Vendia Metrics, a set of operational metrics for nodes and unis. Vendia metrics are enabled for all Nodes and Unis in your account without any additional configuration. The following metrics are now available:
- Mutation Count
- Number of transactions queued
- Transaction queuing time
- Number of consensus errors queued
- Consensus error queueing time
- GraphQL API request count
- GraphQL API latency
- GraphQL API error rate
- End-to-end mutation latency
All Vendia Metrics are visible over a 24-hour period. To view the Vendia Metrics, navigate to a Uni in the Share console and click on the “Metrics” button along the left hand column.
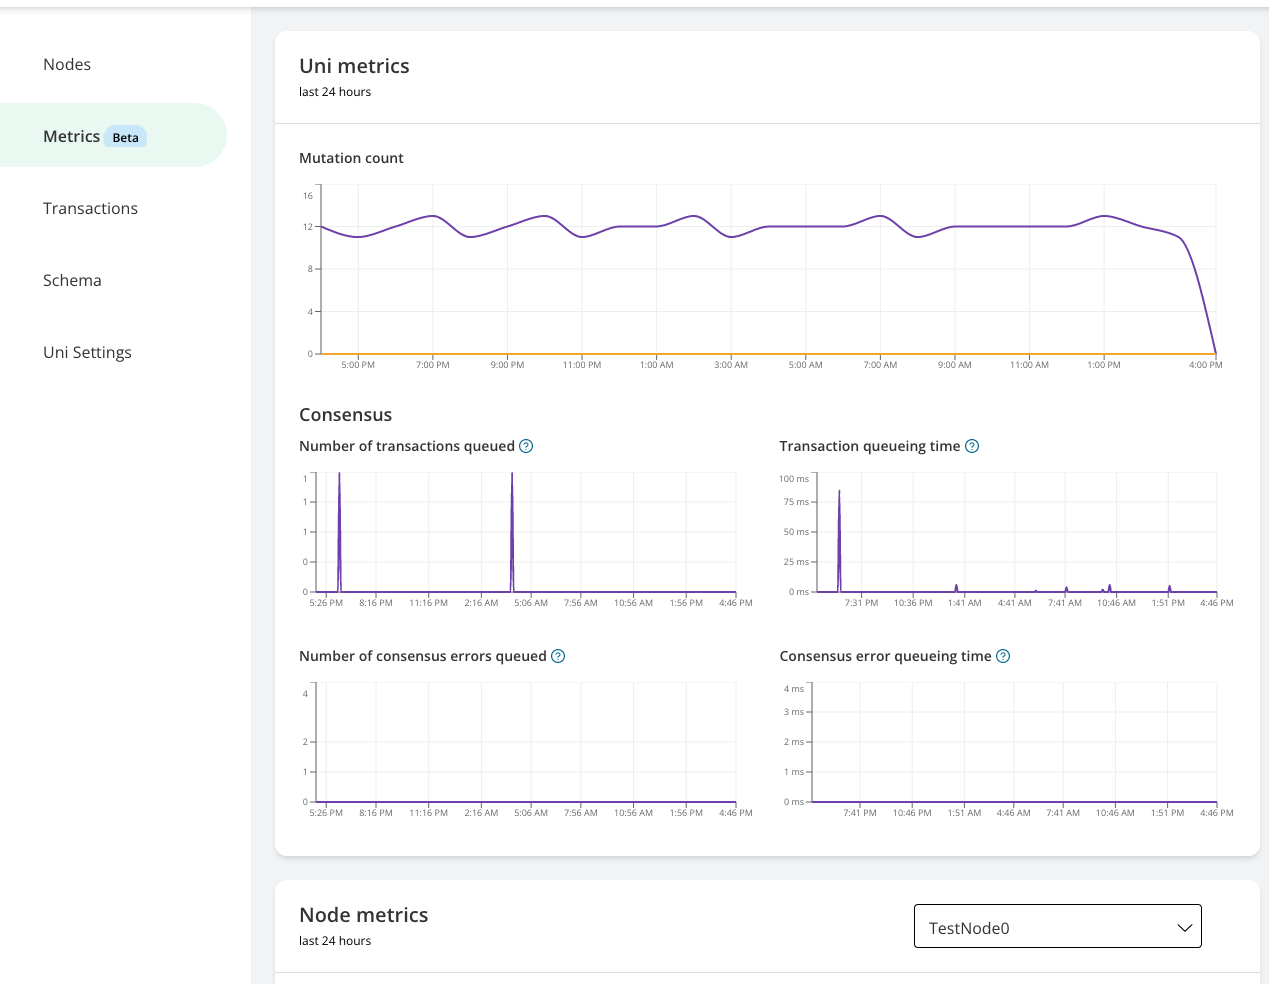
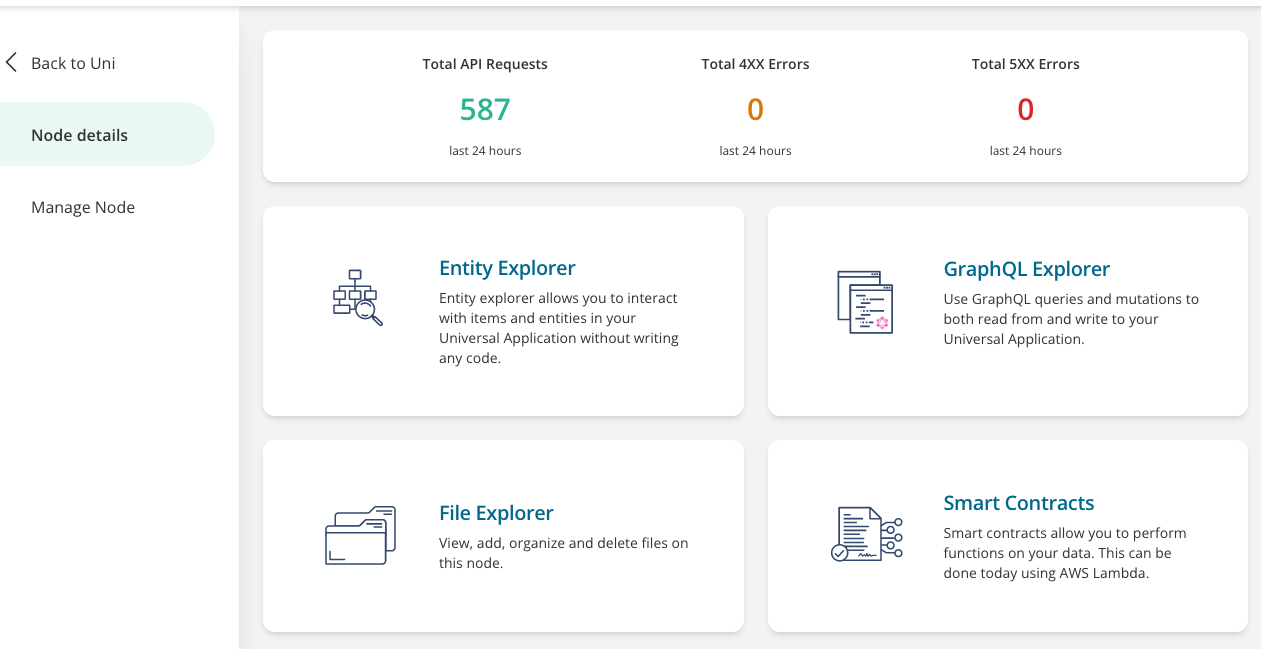
If you navigate into any of the Nodes you own, you will also see a snapshot of the traffic on that Node over the past 24 hours.
Summary
With the read consistency modes, applications built on top of Vendia should become more performant by allowing you to choose between speed and data completeness. And with the new operational metrics, gaining insights into how your unis and nodes are performing just became easier. We hope you enjoy using both of these new features.
Please see our documentation for more information about the new read consistency modes.